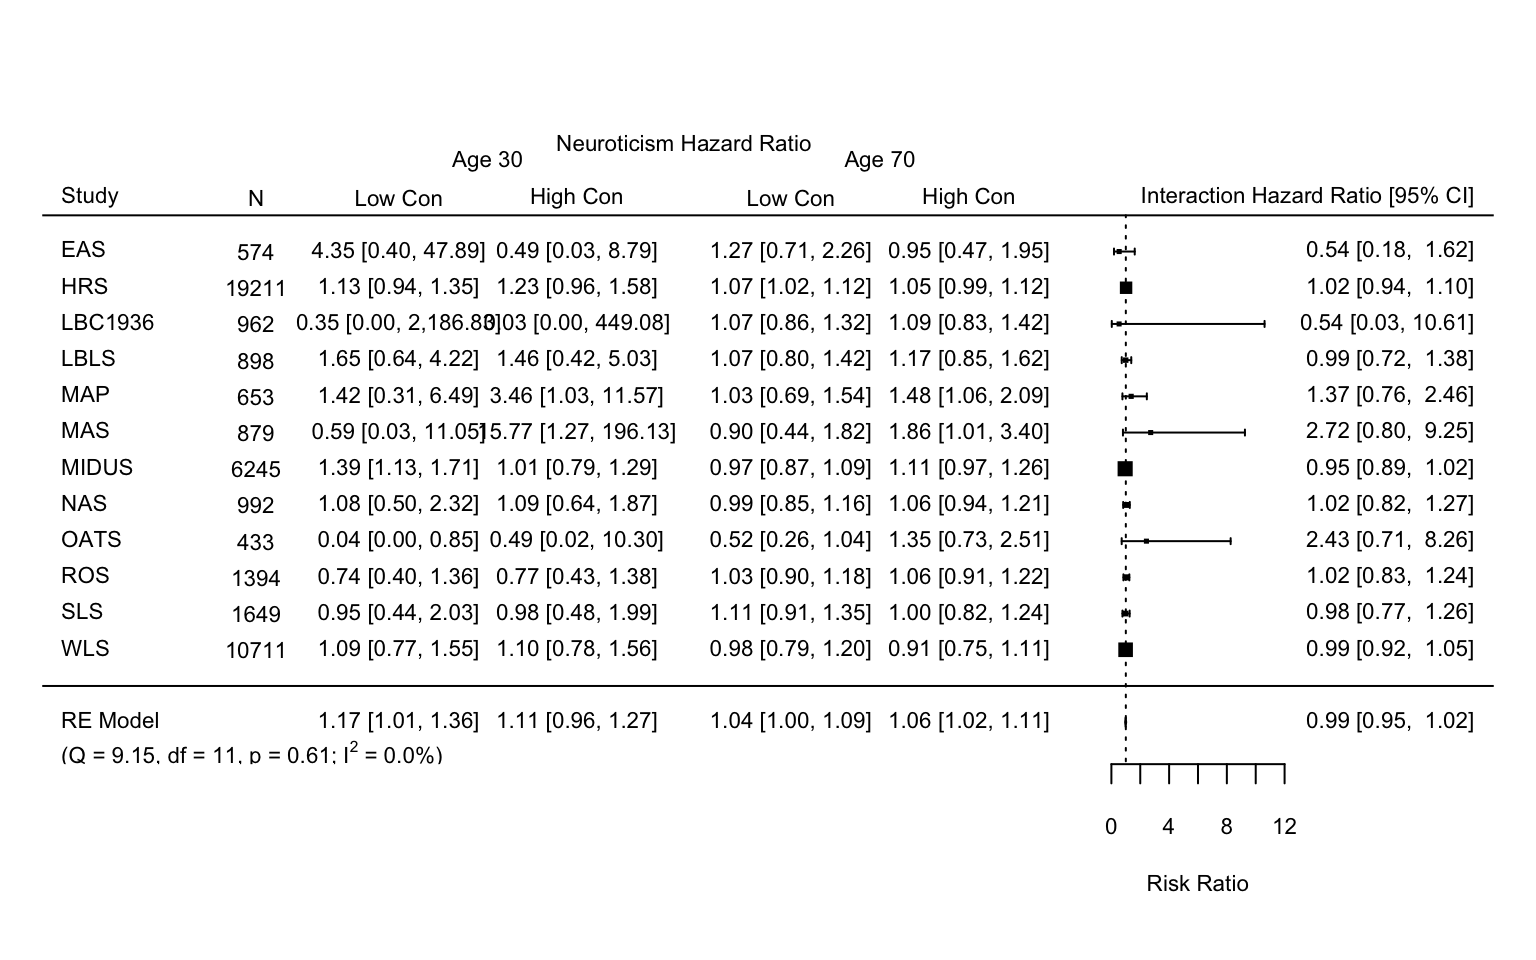
Neuroticism by conscientiousness by age (time since baseline as metric)
This document contains the meta-analysis of the surivival models, using time.age since baseline as the metric of interest and neuroticism by conscientiousness as the predictor of interest.
Code
The following packages were used to generate this table:
library(papaja)
library(tidyverse)
library(metafor)
library(knitr)
library(kableExtra)
library(here)
The files needed for this table are available at osf.io/mzfu9 in the Individual Study Output folder.
First we load the individual study analysis objects.
study.names = c("EAS", "HRS", "LBC", "LBLS", "MAP", "MAS", "MIDUS", "NAS", "OATS", "ROS", "SLS", "WLS")

lapply(here(paste0("mortality/study output/", study.names, "_survival_output.Rdata")), load, .GlobalEnv)
meta.data.time.age <- data.frame()
n <- 0
for(i in study.names){
n <- n+1
x <- get(paste0(i, "_survival_output"))
meta.data.time.age[n, "study"] <- i
meta.data.time.age[n, "coef"] <- x$age.interaction$coef["z.neur:z.con", "coef"]
meta.data.time.age[n, "se"] <- x$age.interaction$coef["z.neur:z.con", "se(coef)"]
meta.data.time.age[n, "n"] <- x$age.interaction$ntotal
meta.data.time.age[n, "low.c_30.est"] <- x$age.interaction$simple.HR$low.c_30["z.neur", "coef"]
meta.data.time.age[n, "low.c_30.se"] <- x$age.interaction$simple.HR$low.c_30["z.neur", "se(coef)"]
meta.data.time.age[n, "hgh.c_30.est"] <- x$age.interaction$simple.HR$hgh.c_30["z.neur", "coef"]
meta.data.time.age[n, "hgh.c_30.se"] <- x$age.interaction$simple.HR$hgh.c_30["z.neur", "se(coef)"]
meta.data.time.age[n, "low.c_70.est"] <- x$age.interaction$simple.HR$low.c_70["z.neur", "coef"]
meta.data.time.age[n, "low.c_70.se"] <- x$age.interaction$simple.HR$low.c_70["z.neur", "se(coef)"]
meta.data.time.age[n, "hgh.c_70.est"] <- x$age.interaction$simple.HR$hgh.c_70["z.neur", "coef"]
meta.data.time.age[n, "hgh.c_70.se"] <- x$age.interaction$simple.HR$hgh.c_70["z.neur", "se(coef)"]
#calculate hazard ratios at low and high C
low.c_30.HR <- exp(x$age.interaction$simple.HR$low.c_30["z.neur", "coef"])
low.c_30.HR.lwr <- exp(x$age.interaction$simple.HR$low.c_30["z.neur", "coef"] - 1.96*x$age.interaction$simple.HR$low.c_30["z.neur", "se(coef)"])
low.c_30.HR.upr <- exp(x$age.interaction$simple.HR$low.c_30["z.neur", "coef"] + 1.96*x$age.interaction$simple.HR$low.c_30["z.neur", "se(coef)"])
meta.data.time.age[n, "low.c_30.CI"] <- paste0(printnum(low.c_30.HR)," [",printnum(low.c_30.HR.lwr),", ",printnum(low.c_30.HR.upr),"]")
hgh.c_30.HR <- exp(x$age.interaction$simple.HR$hgh.c_30["z.neur", "coef"])
hgh.c_30.HR.lwr <- exp(x$age.interaction$simple.HR$hgh.c_30["z.neur", "coef"] - 1.96*x$age.interaction$simple.HR$hgh.c_30["z.neur", "se(coef)"])
hgh.c_30.HR.upr <- exp(x$age.interaction$simple.HR$hgh.c_30["z.neur", "coef"] + 1.96*x$age.interaction$simple.HR$hgh.c_30["z.neur", "se(coef)"])
meta.data.time.age[n, "hgh.c_30.CI"] <- paste0(printnum(hgh.c_30.HR),
" [",printnum(hgh.c_30.HR.lwr),", ",
printnum(hgh.c_30.HR.upr),"]")
low.c_70.HR <- exp(x$age.interaction$simple.HR$low.c_70["z.neur", "coef"])
low.c_70.HR.lwr <- exp(x$age.interaction$simple.HR$low.c_70["z.neur", "coef"] - 1.96*x$age.interaction$simple.HR$low.c_70["z.neur", "se(coef)"])
low.c_70.HR.upr <- exp(x$age.interaction$simple.HR$low.c_70["z.neur", "coef"] + 1.96*x$age.interaction$simple.HR$low.c_70["z.neur", "se(coef)"])
meta.data.time.age[n, "low.c_70.CI"] <- paste0(printnum(low.c_70.HR)," [",printnum(low.c_70.HR.lwr),", ",printnum(low.c_70.HR.upr),"]")
hgh.c_70.HR <- exp(x$age.interaction$simple.HR$hgh.c_70["z.neur", "coef"])
hgh.c_70.HR.lwr <- exp(x$age.interaction$simple.HR$hgh.c_70["z.neur", "coef"] - 1.96*x$age.interaction$simple.HR$hgh.c_70["z.neur", "se(coef)"])
hgh.c_70.HR.upr <- exp(x$age.interaction$simple.HR$hgh.c_70["z.neur", "coef"] + 1.96*x$age.interaction$simple.HR$hgh.c_70["z.neur", "se(coef)"])
meta.data.time.age[n, "hgh.c_70.CI"] <- paste0(printnum(hgh.c_70.HR)," [",printnum(hgh.c_70.HR.lwr),", ",printnum(hgh.c_70.HR.upr),"]")
}
meta.results.time.age <- rma(yi = coef,
sei = se,
ni = n,
measure = "RR",
slab = study,
data = meta.data.time.age)#meta-analyze HR at low and high c
meta.low30.time.age <- rma(yi = low.c_30.est,
sei = low.c_30.se,
ni = n,
measure = "RR",
slab = study,
data = meta.data.time.age)
meta.hgh30.time.age <- rma(yi = hgh.c_30.est,
sei = hgh.c_30.se,
ni = n,
measure = "RR",
slab = study,
data = meta.data.time.age)
meta.low70.time.age <- rma(yi = low.c_70.est,
sei = low.c_70.se,
ni = n,
measure = "RR",
slab = study,
data = meta.data.time.age)
meta.hgh70.time.age <- rma(yi = hgh.c_70.est,
sei = hgh.c_70.se,
ni = n,
measure = "RR",
slab = study,
data = meta.data.time.age)
#find plot limits
max.ci.mod1 = max(exp(meta.data.time.age$coef+1.96*meta.data.time.age$se))
min.ci.mod1 = min(exp(meta.data.time.age$coef-1.96*meta.data.time.age$se))
range.mod1 = max.ci.mod1-min.ci.mod1
lower.mod1 = min.ci.mod1-(range.mod1*7)
upper.mod1 = max.ci.mod1+(range.mod1*1.5)
cex.set = .7
#estimate position of extra information
pos.mod1 = min.ci.mod1-lower.mod1
pos.mod1 = pos.mod1/15
pos.mod1 = c(lower.mod1+3*pos.mod1,
lower.mod1+5*pos.mod1,
lower.mod1+7.5*pos.mod1,
lower.mod1+10.5*pos.mod1,
lower.mod1+13*pos.mod1)
#extract weighted values at -1 and +1 sd
meta_est_low.c_30_mod1 = printnum(exp(meta.low30.time.age$b))
meta_lwr_low.c_30_mod1 = printnum(exp(meta.low30.time.age$ci.lb))
meta_upr_low.c_30_mod1 = printnum(exp(meta.low30.time.age$ci.ub))
meta_low.c_30_ci_mod1 = paste0(meta_est_low.c_30_mod1, " [",
meta_lwr_low.c_30_mod1, ", ",
meta_upr_low.c_30_mod1, "]")
meta_est_hgh.c_30_mod1 = printnum(exp(meta.hgh30.time.age$b))
meta_lwr_hgh.c_30_mod1 = printnum(exp(meta.hgh30.time.age$ci.lb))
meta_upr_hgh.c_30_mod1 = printnum(exp(meta.hgh30.time.age$ci.ub))
meta_hgh.c_30_ci_mod1 = paste0(meta_est_hgh.c_30_mod1, " [",
meta_lwr_hgh.c_30_mod1, ", ",
meta_upr_hgh.c_30_mod1, "]")
meta_est_low.c_70_mod1 = printnum(exp(meta.low70.time.age$b))
meta_lwr_low.c_70_mod1 = printnum(exp(meta.low70.time.age$ci.lb))
meta_upr_low.c_70_mod1 = printnum(exp(meta.low70.time.age$ci.ub))
meta_low.c_70_ci_mod1 = paste0(meta_est_low.c_70_mod1, " [",
meta_lwr_low.c_70_mod1, ", ",
meta_upr_low.c_70_mod1, "]")
meta_est_hgh.c_70_mod1 = printnum(exp(meta.hgh70.time.age$b))
meta_lwr_hgh.c_70_mod1 = printnum(exp(meta.hgh70.time.age$ci.lb))
meta_upr_hgh.c_70_mod1 = printnum(exp(meta.hgh70.time.age$ci.ub))
meta_hgh.c_70_ci_mod1 = paste0(meta_est_hgh.c_70_mod1, " [",
meta_lwr_hgh.c_70_mod1, ", ",
meta_upr_hgh.c_70_mod1, "]")#forest plot
meta.data.time.age$study = gsub("LBC", "LBC1936", meta.data.time.age$study)
forest(meta.results.time.age,
xlim = c(lower.mod1, upper.mod1),
cex = cex.set,
slab = meta.data.time.age$study,
transf=exp,
refline = 1,
ilab = meta.data.time.age[,c("n",
"low.c_30.CI",
"hgh.c_30.CI",
"low.c_70.CI",
"hgh.c_70.CI")],
ilab.xpos = pos.mod1)
# #additional text
text(pos.mod1[1], length(study.names)+1.5,
c("N"), cex = cex.set)
text(pos.mod1[2], length(study.names)+1.5,
c("Low Con"), cex = cex.set)
text(pos.mod1[3], length(study.names)+1.5,
c("High Con"), cex = cex.set)
text(pos.mod1[4], length(study.names)+1.5,
c("Low Con"), cex = cex.set)
text(pos.mod1[5], length(study.names)+1.5,
c("High Con"), cex = cex.set)
text((pos.mod1[2]+pos.mod1[3])/2, length(study.names)+2.5,
c("Age 30"), cex = cex.set)
text((pos.mod1[4]+pos.mod1[5])/2, length(study.names)+2.5,
c("Age 70"), cex = cex.set)
text((pos.mod1[3]+pos.mod1[4])/2, length(study.names)+3,
"Neuroticism Hazard Ratio", cex = cex.set)
text(lower.mod1, length(study.names)+1.5,
"Study", cex = cex.set, pos = 4)
text(upper.mod1, length(study.names)+1.5,
"Interaction Hazard Ratio [95% CI]", cex = cex.set, pos=2)
text(pos.mod1[2:5], -1,
c(meta_low.c_30_ci_mod1, meta_hgh.c_30_ci_mod1,
meta_low.c_70_ci_mod1, meta_hgh.c_70_ci_mod1), cex = cex.set)
text(lower.mod1, -2, pos=4, cex=cex.set,
bquote(paste("(Q = ",
.(formatC(meta.results.time.age$QE, digits=2, format="f")),
", df = ", .(meta.results.time.age$k - meta.results.time.age$p),
", p = ", .(formatC(meta.results.time.age$QEp, digits=2, format="f")),
"; ", I^2, " = ",
.(formatC(meta.results.time.age$I2, digits=1, format="f")), "%)")))